
 可视化ping监控:基于Python+InfluxDB+Grafana的实践
# 前言
作为运维工程师或网络管理员,你是否经常需要监控公司网络中各节点的连通性和延迟情况?
今天分享一个python+influxdb+grafana的轻量级网络监控方案,能够自动Ping你想要监控的目标IP并将丢包和延时结果可视化展示。
# 一、痛点:传统网络监控的不足
在日常网络运维中,我们经常需要: 监控各办公点、机房、云服务器的网络质量 实时了解网络延迟和丢包情况 历史数据追溯,分析网络趋势 传统的手动Ping或简单脚本存在以下问题: 数据无法持久化存储 缺乏可视化展示 无法多目标并发监控 没有历史趋势分析
# 二、解决方案架构设计
Python监控脚本 → InfluxDB时序数据库 → Grafana可视化展示
工作流程:
Python脚本并发Ping所有目标IP
结果写入InfluxDB时序数据库
Grafana读取数据并生成监控图表
我下面的案例中 python脚本、influxdb、grafana 都部署在一台机器上
# 三、安装influxdb
以centos为例:
# 下载RPM包
wget https://dl.influxdata.com/influxdb/releases/influxdb-1.8.10.x86_64.rpm
# yum安装influxdb
yum install influxdb-1.8.10.x86_64.rpm
# 启动influxdb
systemctl start influxdb.service
systemctl enable influxdb.service
1
2
3
4
5
6
7
2
3
4
5
6
7
# 四、完整代码
# 3.1 目录结果
├── dst_ip.json  #需要监控的目标IP
└── ping.py      #ping脚本
1
2
2
# 3.2 dst_ip.json文件内容格式参考
[
  {"ISP":"阿里云","IP":"223.5.5.5"},
  {"ISP":"腾讯云","IP":"119.29.29.29"},
  {"ISP":"百度云","IP":"180.76.76.76"},
  {"ISP":"上海电信","IP":"202.96.209.5"},
  {"ISP":"北京电信","IP":"202.96.199.133"}
]
1
2
3
4
5
6
7
2
3
4
5
6
7
优势:增删监控目标无需修改代码,只需更新配置文件
# 3.3 监控脚本
import time
import os
import threading
import json
from ping3 import ping
from influxdb import InfluxDBClient
from influxdb.exceptions import InfluxDBClientError

# =============== 配置变量(可修改) ===============
MONITORING_SOURCE = "office"      #监控源名称
INFLUXDB_HOST = '127.0.0.1'   #InfluxDB服务器地址
INFLUXDB_PORT = 8086              #InfluxDB服务器端口
INFLUXDB_TIMEOUT = 3              #InfluxDB连接超时时间
DATABASE_NAME = 'icmp_Monitor'    #InfluxDB数据库名称
IP_CONFIG_FILE = 'dst_ip.json'    # IP列表配置文件
PING_TIMEOUT = 1  # 秒            # Ping超时时间
MAIN_LOOP_INTERVAL = 5  # 主循环间隔(秒),即每隔5秒执行一次ping
THREAD_JOIN_TIMEOUT = 2  # 线程等待超时(秒)
# ==============================================


# 创建InfluxDB连接
def create_influx_client():
    try:
        client = InfluxDBClient(
            host=INFLUXDB_HOST,
            port=INFLUXDB_PORT,
            timeout=INFLUXDB_TIMEOUT
        )

        # 检查数据库是否存在,不存在则创建
        databases = client.get_list_database()
        database_exists = False

        for db in databases:
            if db['name'] == DATABASE_NAME:
                database_exists = True
                break

        if not database_exists:
            print(f"数据库 '{DATABASE_NAME}' 不存在,正在创建...")
            client.create_database(DATABASE_NAME)
            print(f"数据库 '{DATABASE_NAME}' 创建成功")

        client.switch_database(DATABASE_NAME)
        return client
    except Exception as e:
        print(f"创建InfluxDB连接失败: {e}")
        return None


def get_iplist():
    current_dir = os.getcwd()
    ip_file = os.path.join(current_dir, IP_CONFIG_FILE)
    try:
        with open(ip_file, encoding='utf-8') as f:
            iplist_data = json.load(f)
            return iplist_data
    except FileNotFoundError:
        print(f"配置文件不存在: {ip_file}")
        return []
    except json.JSONDecodeError as e:
        print(f"JSON解析错误: {e}")
        return []
    except Exception as error:
        print(f"读取配置文件错误: {error}")
        return []


def write_to_influx(client, dst_isp, influx_stamp, ping_rtt, ping_loss):
    """写入数据到InfluxDB"""
    if client is None:
        return False

    json_body = [
        {
            "measurement": MONITORING_SOURCE,
            "tags": {
                "dst_isp": dst_isp
            },
            "time": influx_stamp,
            "fields": {
                "rrt": ping_rtt,
                "loss": ping_loss
            }
        }
    ]

    try:
        result = client.write_points(json_body)
        if result:
            print(f"数据成功写入InfluxDB: {dst_isp}, RTT: {ping_rtt}ms, Loss: {ping_loss}%")
        return result
    except InfluxDBClientError as e:
        print(f"写入InfluxDB失败: {e}")
        return False
    except Exception as e:
        print(f"写入数据异常: {e}")
        return False


def ping_host(dst_isp_ip, dst_isp, influx_stamp, client):
    """ping目标主机并记录结果"""
    try:
        ping_result = ping(dst_isp_ip, timeout=PING_TIMEOUT, unit="ms")

        if ping_result is None or ping_result is False:
            ping_loss = 100
            ping_rtt = 0
            print(f'无法ping通: {dst_isp_ip} ({dst_isp}) 丢包率: {ping_loss}%')
        else:
            ping_loss = 0
            ping_rtt = float(ping_result)
            print(f'ping通: {dst_isp_ip} ({dst_isp}) 延迟: {ping_rtt:.2f}ms')

        # 写入数据
        write_to_influx(client, dst_isp, influx_stamp, ping_rtt, ping_loss)

    except Exception as e:
        print(f"ping {dst_isp_ip} 时出错: {e}")


def main_loop():
    """主监控循环"""
    # 创建InfluxDB客户端
    client = create_influx_client()
    if client is None:
        print("无法连接到InfluxDB,程序退出")
        return

    try:
        while True:
            loop_start_time = time.time()
            influx_stamp = int(loop_start_time * 1000000000)  # 纳秒时间戳

            # 获取IP列表
            iplist = get_iplist()
            # 创建并启动线程
            threads = []
            for v in iplist:
                dst_ip = v.get('IP')
                dst_isp = v.get('ISP')

                if not dst_ip or not dst_isp:
                    print(f"跳过无效记录: {v}")
                    continue

                t = threading.Thread(
                    target=ping_host,
                    args=(dst_ip, dst_isp, influx_stamp, client)
                )
                threads.append(t)
                t.daemon = True  # 设置为守护线程
                t.start()

            # 等待所有线程完成
            for t in threads:
                t.join(timeout=THREAD_JOIN_TIMEOUT)  # 设置超时防止线程挂起

            # 计算并控制循环间隔
            loop_end_time = time.time()
            runtime = loop_end_time - loop_start_time
            sleep_time = max(MAIN_LOOP_INTERVAL - runtime, 0.1)  # 最少休眠0.1秒

            if runtime > MAIN_LOOP_INTERVAL:
                print(f"警告: 循环执行时间({runtime:.2f}s)超过{MAIN_LOOP_INTERVAL}秒")

            time.sleep(sleep_time)

    except KeyboardInterrupt:
        print("\n收到中断信号,程序退出")
    except Exception as e:
        print(f"主循环异常: {e}")
    finally:
        # 清理资源
        try:
            client.close()
        except:
            pass
        print("连接已关闭")


if __name__ == '__main__':
    main_loop()
1
2
3
4
5
6
7
8
9
10
11
12
13
14
15
16
17
18
19
20
21
22
23
24
25
26
27
28
29
30
31
32
33
34
35
36
37
38
39
40
41
42
43
44
45
46
47
48
49
50
51
52
53
54
55
56
57
58
59
60
61
62
63
64
65
66
67
68
69
70
71
72
73
74
75
76
77
78
79
80
81
82
83
84
85
86
87
88
89
90
91
92
93
94
95
96
97
98
99
100
101
102
103
104
105
106
107
108
109
110
111
112
113
114
115
116
117
118
119
120
121
122
123
124
125
126
127
128
129
130
131
132
133
134
135
136
137
138
139
140
141
142
143
144
145
146
147
148
149
150
151
152
153
154
155
156
157
158
159
160
161
162
163
164
165
166
167
168
169
170
171
172
173
174
175
176
177
178
179
180
181
182
183
184
# 五、安装grafana并添加influxdb数据源
# 5.1 安装grafana
grafana下载链接:https://grafana.com/grafana/download?pg=get&plcmt=selfmanaged-box1-cta1
以centos为例:
# yum安装
yum install -y https://dl.grafana.com/grafana-enterprise/release/12.3.1/grafana-enterprise_12.3.1_20271043721_linux_amd64.rpm
# 启动grafana
systemctl start grafana-server
systemctl enable grafana-server
1
2
3
4
5
6
2
3
4
5
6
# 5.2 添加influxdb数据源
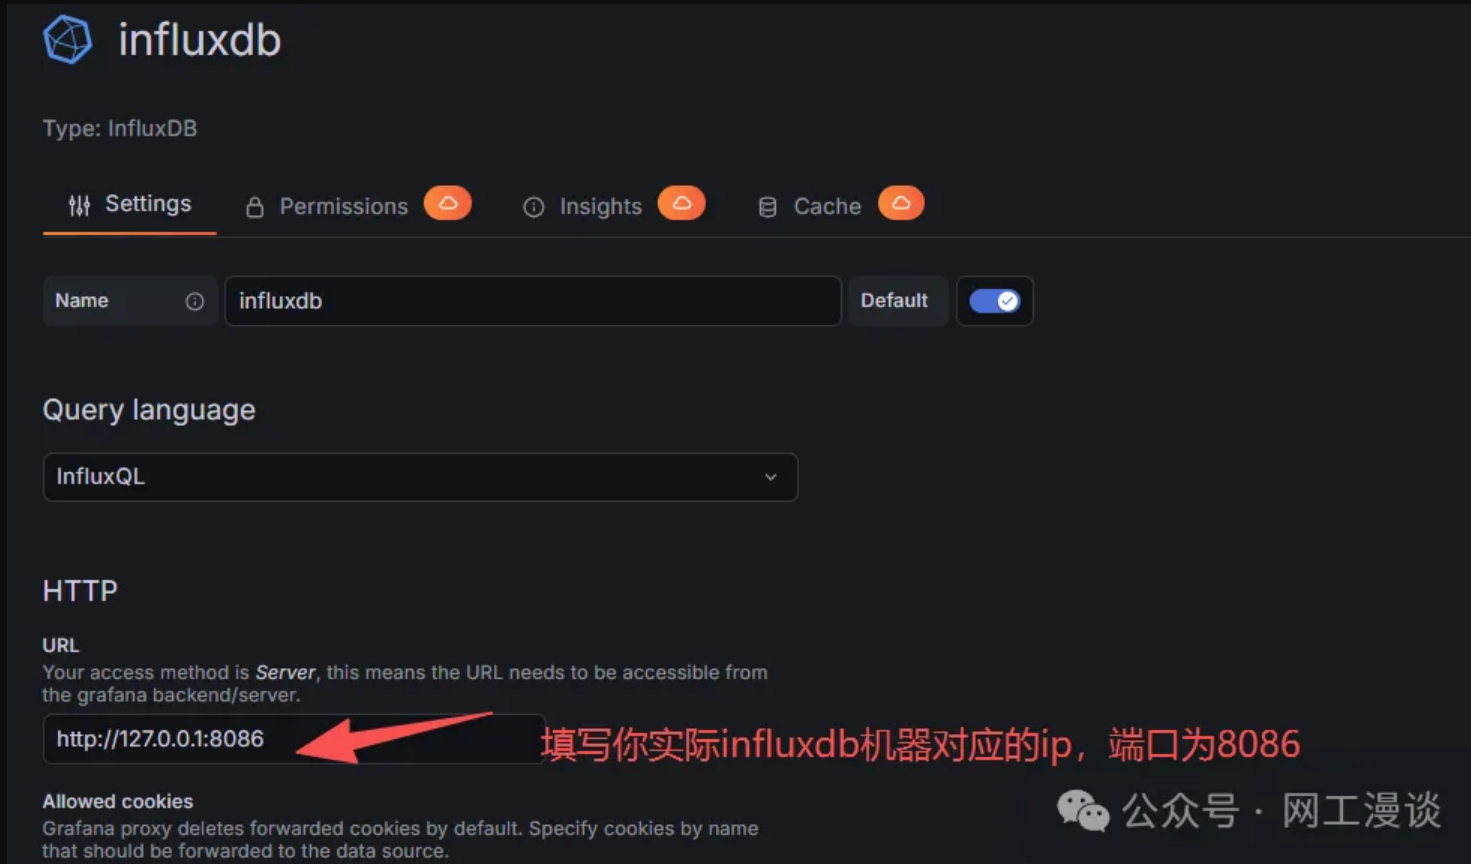
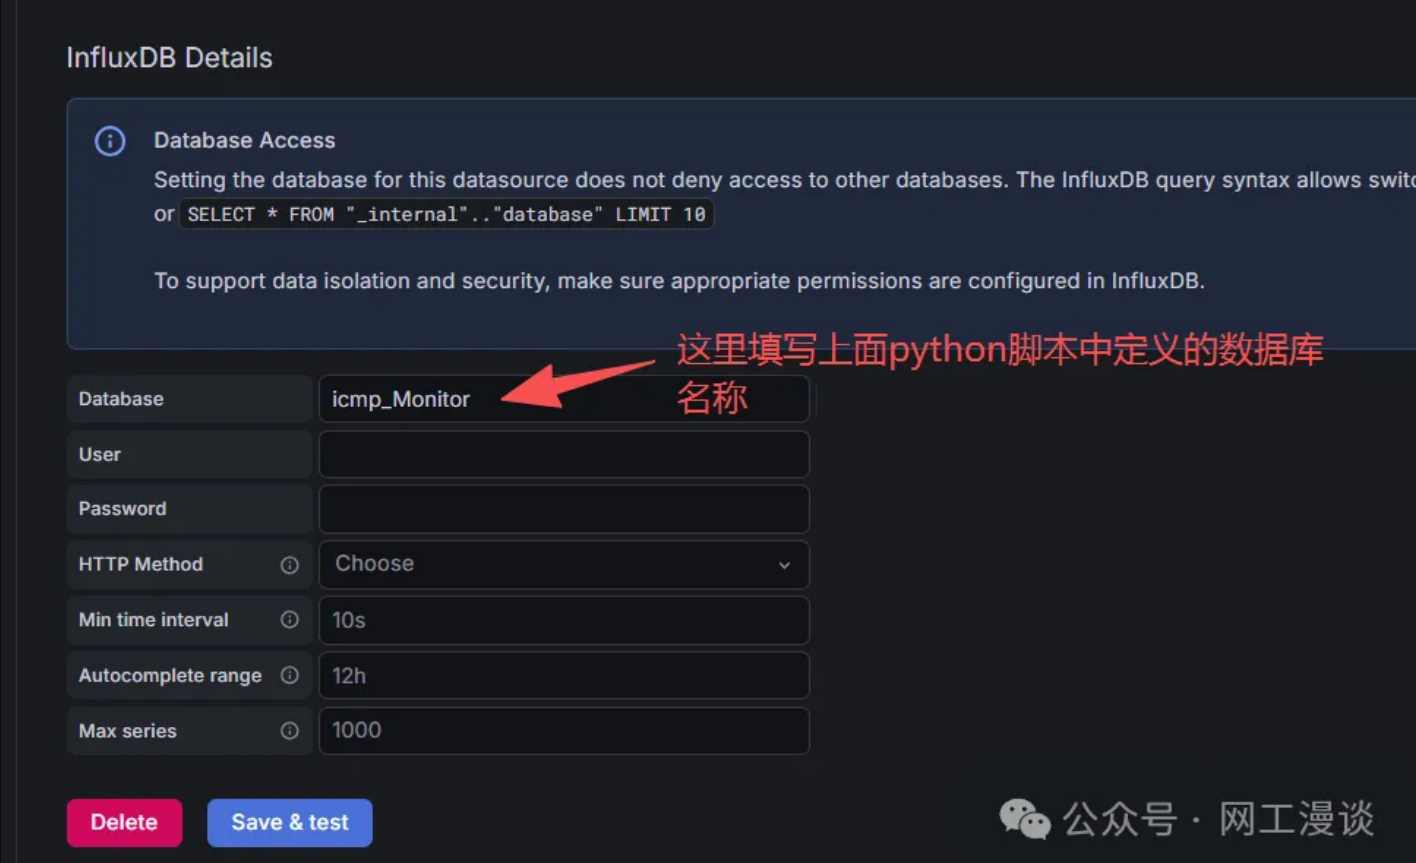
最后在使用influxdb数据源添加图形即可,得到如下效果:
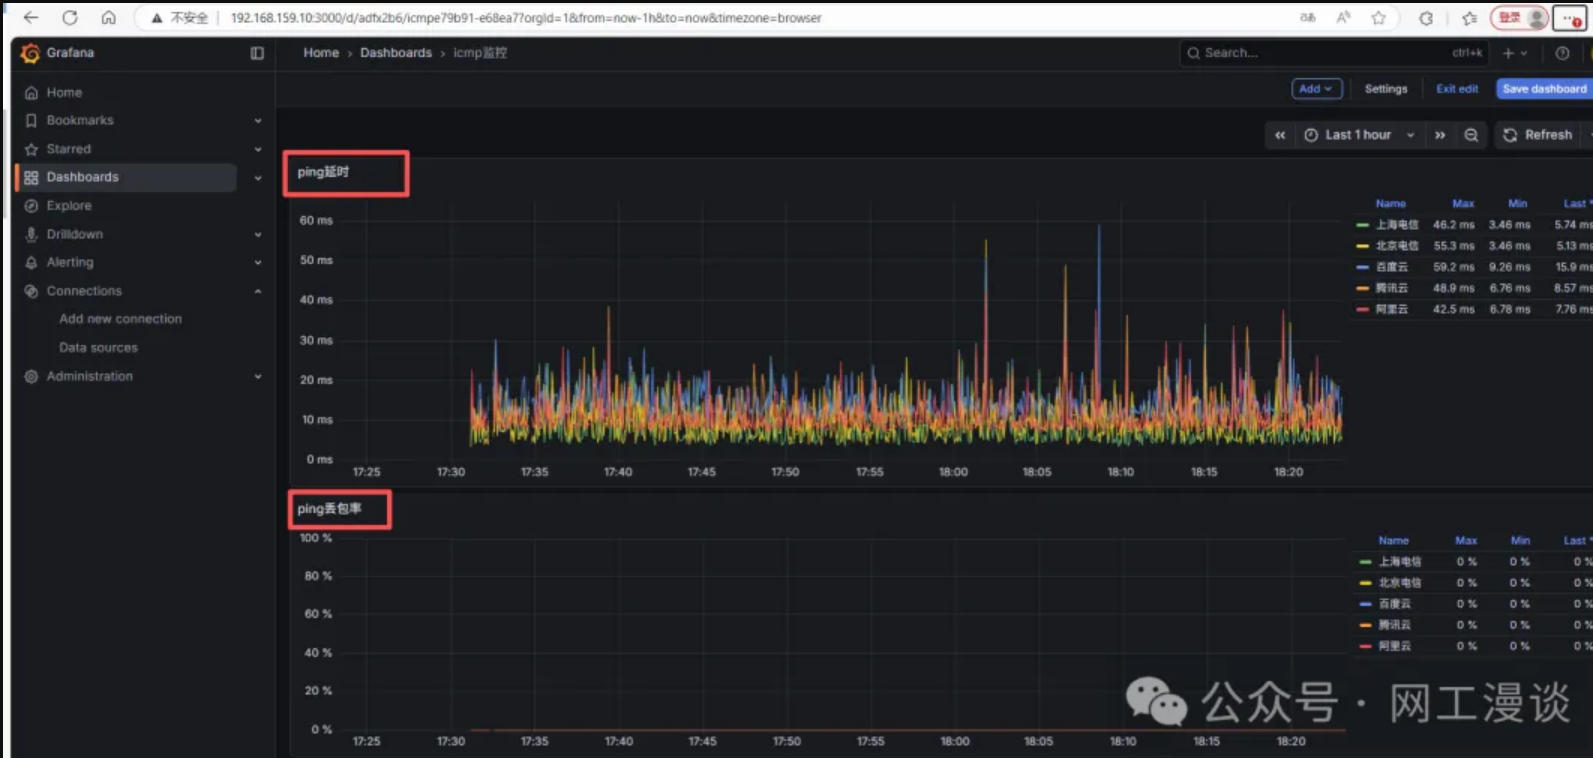
由于结果是存储在influxdb数据库中,所以后期也可以在编写脚本对influxdb的结果进行过滤获取丢包率并发送微信或者钉钉告警通知,如果感兴趣的同学较多,后续这个会在单独介绍


上次更新: 2026/01/28, 11:04:59
 |
|